Who is in your classroom?
What do they have in common?
They all depend on you to teach them.
How do we meet the needs of such a diverse group of learners?
By employing differentiated instruction.
To employ differentiated instruction you will need to understand more about your students. Who are they and what are they learning, what are they struggling with, etc. etc. This is where surveys, polls, and quizzes come in handy.
By employing differentiated instruction.
To employ differentiated instruction you will need to understand more about your students. Who are they and what are they learning, what are they struggling with, etc. etc. This is where surveys, polls, and quizzes come in handy.

|
Traditional surveys have been face-to-face, then they evolved to phone interviews. The new trend is an internet-based, self-administered survey. For face-to-face surveys, people are less likely to give socially undesirable answers. For example, if you ask your students face-to-face, "How would you rate my class?" they are less likely to say anything negative. But turn around, when they fill up the teacher evaluation, they will rate the class ruthlessly. (Michael J 2014)
For onsite instructors, there is the advantage of face-to-face interaction with the students. Leveraging face-to-face opportunity and online surveys, polls and quizzes can help instructors better understand the student. |
A few things about survey, poll and quiz design
Good questions are essential. There are many articles that focus on how to design questionnaires. Below are a few technical essentials I found very helpful.
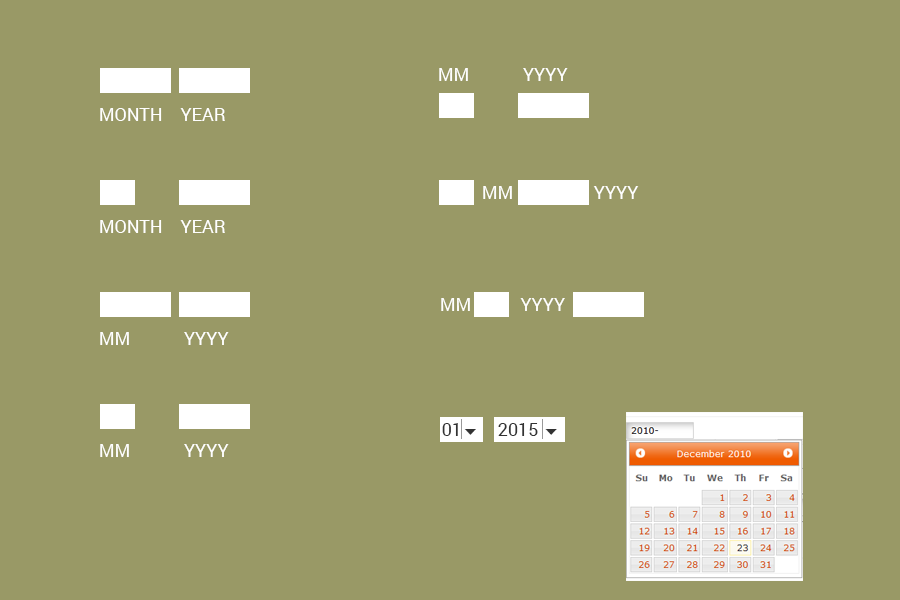
Help the respondent to get it right the first time with clear instructions.
Many web surveys have error messages to help respondents if they left a blank answer or the answer is not in the correct format. However, error messages increase respondent frustration and survey termination (Best & Krueger, 2004). It is better if we can give clear , easy to follow instructions before the respondent takes the survey/quiz.
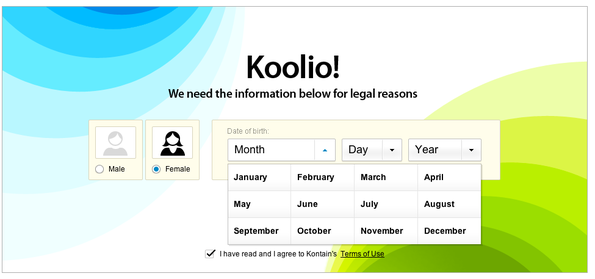
Give verbal instruction if you can.
Studies reveal there is a hierarchy of importance in regards to verbal and visual instructions. (Toepoel & Couper, 2011; Toepoel & Dillman, 2011)
Studies reveal there is a hierarchy of importance in regards to verbal and visual instructions. (Toepoel & Couper, 2011; Toepoel & Dillman, 2011)
Verbal Labels > Numerical Labels > Visual Cues
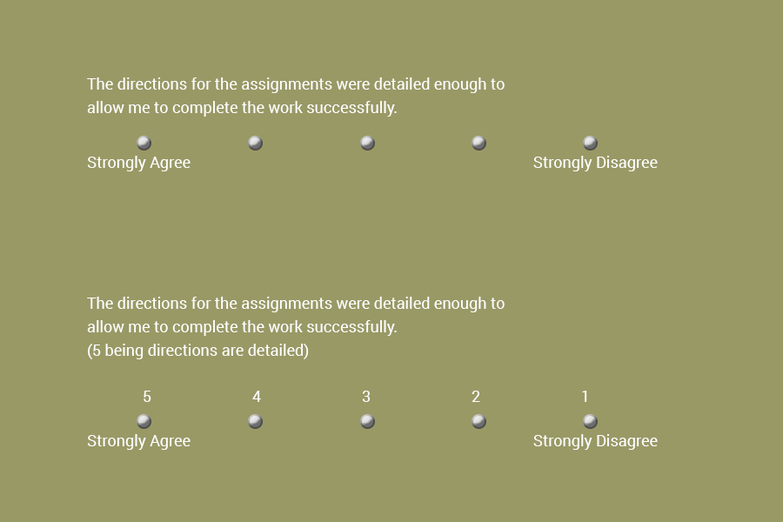
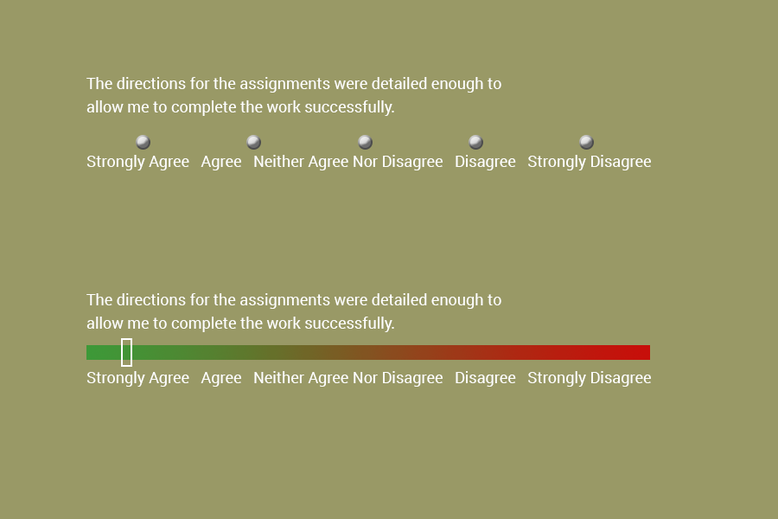
Add numbers, symbols and graphics
In addition to words, numbers, symbols and graphics also influence how respondents answer the question. (Christian et al., 2007; Toepoel & Dillman, 2011)
In addition to words, numbers, symbols and graphics also influence how respondents answer the question. (Christian et al., 2007; Toepoel & Dillman, 2011)
Group your questions.
According to the principles of similarity and proximity, images are more likely to be perceived as related if they resemble one another and/or are located in close proximity to one another. When designing a long form, try to group the questions together, and also consider using double or triple banking. You can group the questions by separate sections, or different pages.
Think about the trade-off between scrolling and clicking. Display everything on one page for short questionnaires. Use groups wisely for longer questionnaires. Group questions comprehensibly; use group descriptions to give a clear statement about the topic of the following questions (Dillman, Tortora, & Bowker, 1999).
Use open-ended question strategically.
Closed ended questions are much easier to total up later on, but may stop people giving an answer they really want (“How to design a good survey (guide) - LimeSurvey Manual,” n.d.)
When unbiased answers are strongly desired an open-ended question is a great approach.
When constructing open-ended questionnaires, be aware that the tone of the question can affect respondents' answers (Brennan, 1997).
Example
A three single-cue questions were taken from Gendall et al. (1996). These questions sought to elicit respondents' opinions of surveys and opinion polls. These variations were designed to produce either a neutral, positive, negative, or combined cue tone. The four questions were as follows:
|
Neutral
"What comments do you have about surveys or opinion polls?" Positive "What benefits or advantages do you see in surveys or opinion polls? Negative "What objections or concerns do you have about surveys or opinion polls? Combined "Now I'd like to ask you about the positive and negative aspects of surveys and opinion polls. What objections or concerns do you have, and what benefits or advantages do you see in them? |
Consider using concept map as an alternative approach for open-ended question analysis (Jackson & Trochim, 2002).
References:
Best, S. J., & Krueger, B. S. (2004). Internet data collection. SAGE.
Brennan, M. (1997). The effect of question tone on response to open-ended questions. Marketing Bulletin, 8, 66.
Christian, L. M., Dillman, D. A., & Smyth, J. D. (2007). Helping respondents get it right the first time: The influence of words, symbols, and graphics in web surveys. Public Opinion Quarterly, 71(1), 113–125.
Dillman, D. A., Tortora, R., & Bowker, D. (1999, April). Principles for constructing web surveys. Retrieved August 19, 2015, from http://www.researchgate.net/profile/Don_Dillman/publication/2465935_Principles_for_Constructing_Web_Surveys/links/549813cb0cf2519f5a1db6de.pdf
How to design a good survey (guide) - LimeSurvey Manual. (n.d.). Retrieved August 19, 2015, from https://manual.limesurvey.org/How_to_design_a_good_survey_(guide)#What_makes_a_good_survey.3F
Jackson, K. M., & Trochim, W. M. K. (2002). Concept mapping as an alternative approach for the analysis of open-ended survey responses. Organizational Research Methods, 5(4), 307–336. http://doi.org/10.1177/109442802237114
Toepoel, V., & Couper, M. P. (2011). Can verbal instructions counteract visual context effects in web surveys? Public Opinion Quarterly, 75(1), 1–18.
Toepoel, V., & Dillman, D. A. (2011). Words, numbers, and visual heuristics in web surveys: Is there a hierarchy of importance? Social Science Computer Review, 29(2), 193–207. http://doi.org/10.1177/0894439310370070
